Results-driven professional with linux and azure cloud background. Proficient in Python, R, SPSS, Advanced Excel, Tableau, and data analysis. Drives revenue growth and enhances customer experiences through data-driven insights. Skilled in end-to-end data science processes, collaboration, and successful project delivery. Committed to continuous learning and leveraging skills for impactful outcomes.
Technical skills
| Data Manipulation and analysis |
Statistical analysis and Modeling |
Database Management |
Simulation and forecast tools |
Data visualization |
| Advanced Excel |
SPSS statistics |
PostgreSQL |
Crystal Ball |
Power BI |
| Power Query |
SPSS Modeller |
|
What if analysis |
Tableau |
| Python(pandas, numpy etc.,) |
Python(scikit-learn, tensorflow etc.,) |
|
|
Python(matplotlib, seaborn) |
| R Language |
R(CAR, lm, glm) |
|
|
R(ggplot2) |
Portifolio
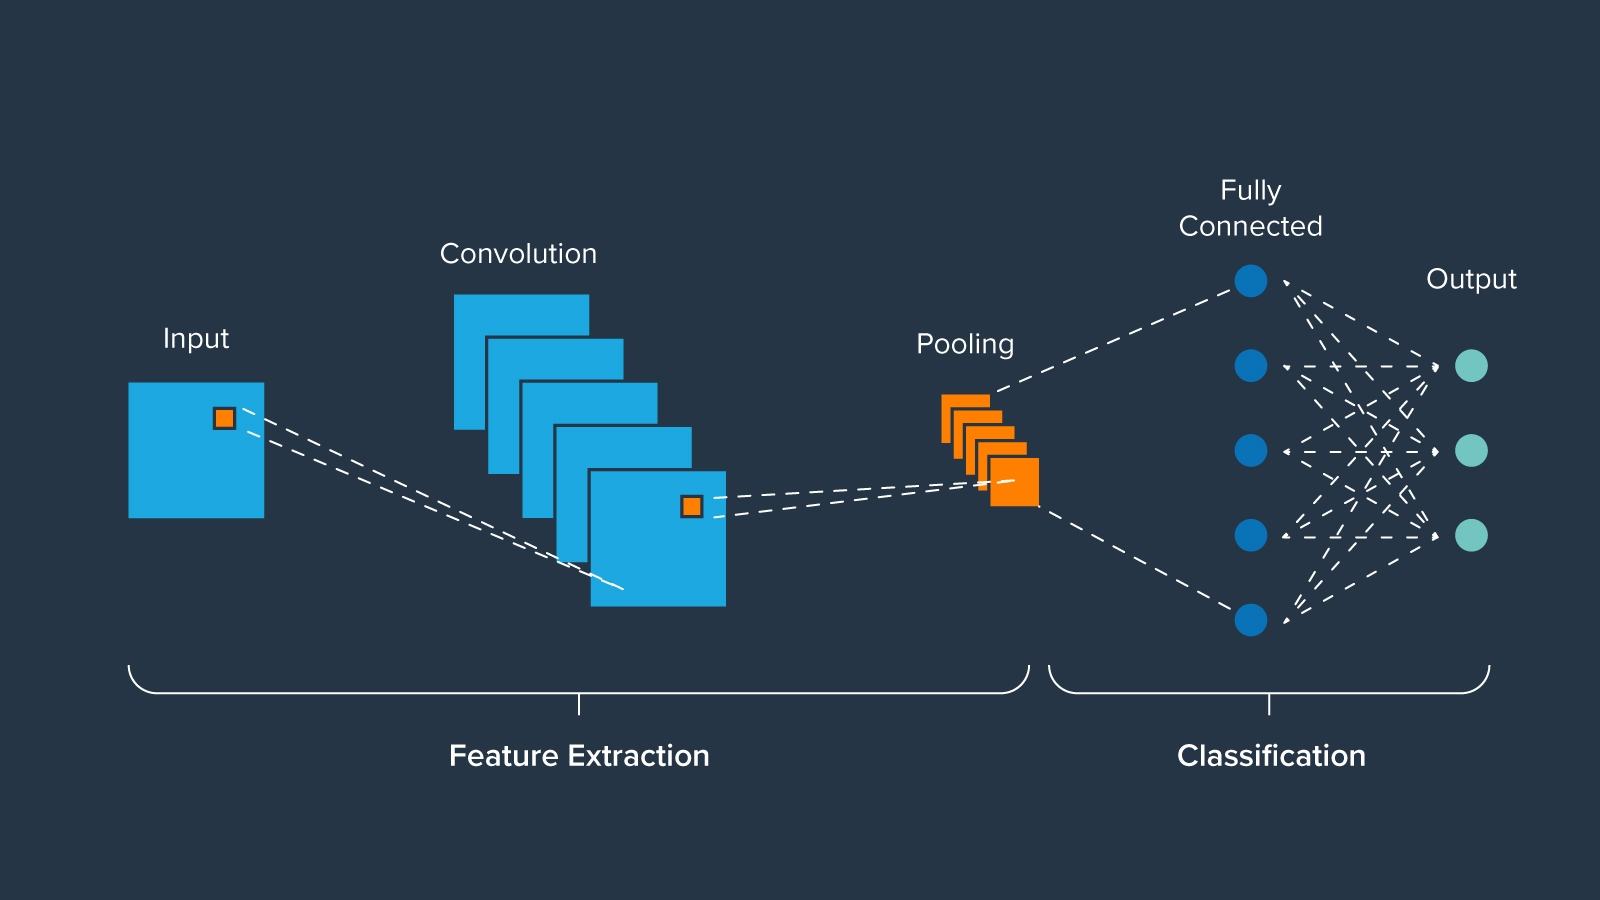
Binary, Multiclass Image classification using tesnsorflow convolution model
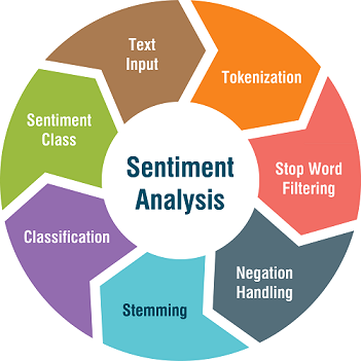
Comment Toxicity identifier based on toxic comments dataset from kaggle trained based on tokenized data and prediction
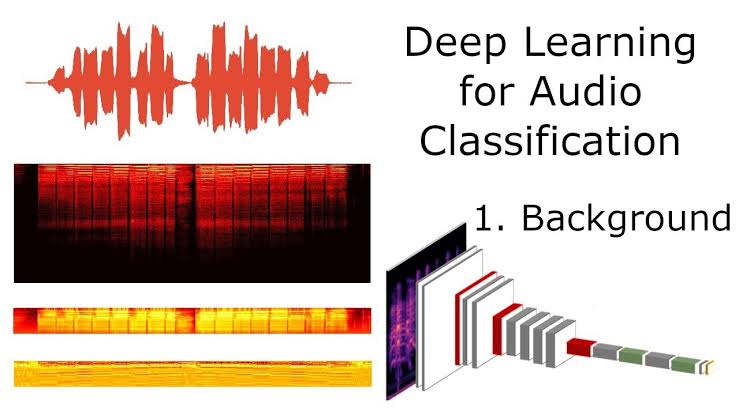
Binary audio classification task where we are trying to detect specific sounds (capuchin calls) within forest recordings
Linear regression using Auto dataset to traceback Horsepower with mpg and weight after a basic missing vlaue cleanup and few seaborn plots to understand correlation between available variables

Data analysis using bollywood and auto datasets with pandas and solving a few challenges involving sort and performing univariate, multivariate analysis

Data manipulation using pandas on gapminder dataset with actions such as subsetting, arriving on intended data using loc, iloc funcions

Create, read, update and delete of datatypes like list, tuples and dictionary and slicing properties

IPL 2023 Dashboard using ball by ball scoring data from kaggle and match info from cric info which are combined through power query and are visualised inorder to assess team performance with a slicer
Life expectancy dashboard using Life expectancy dataset from kaggle which is visualized based on life expectancy rate grouped by interval showing Adult and ifnant morality rate, various deadly diseases per 1000 people over the years
Multiple Linear regression using Carseats dataset to to predict sales of the car using variables such as Price of the car, Urbanmodel (Yes/No), US(Yes/No)
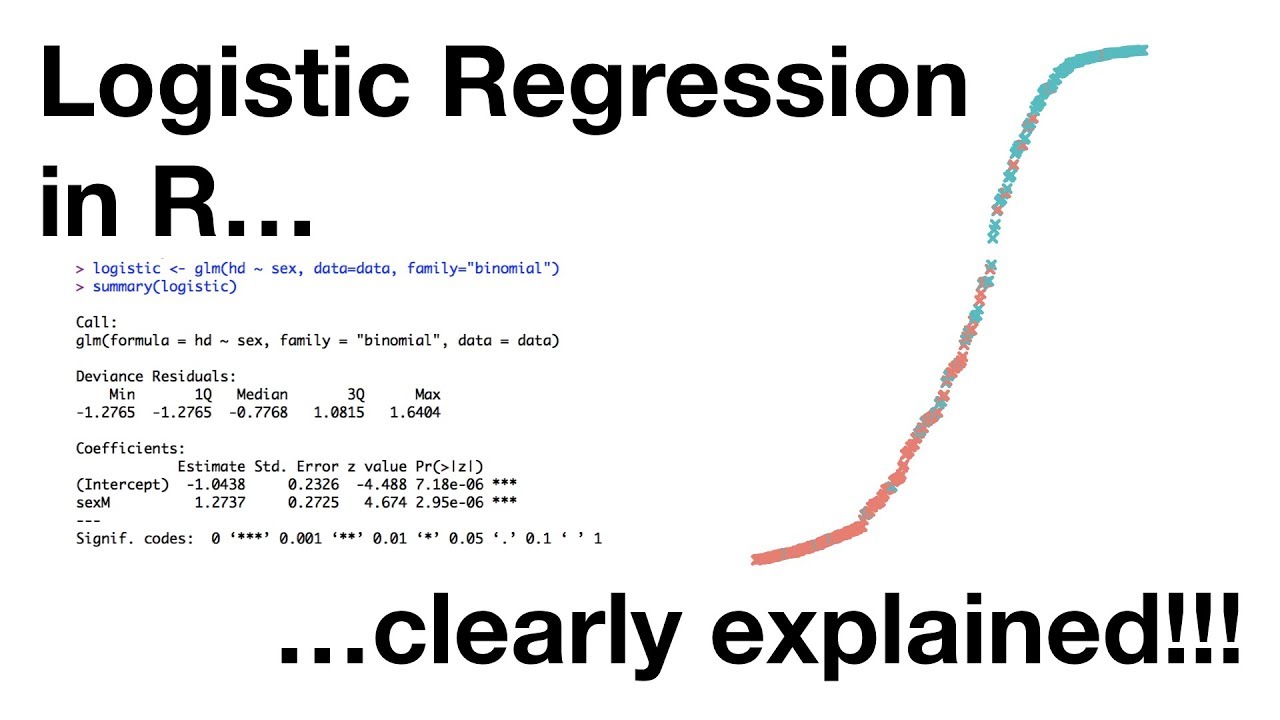
Logistic Regression using Cellphone dataset to identify whether a customer will churn or retain basing on various factors and identifying the significant variables impacting the regression